Live Gamma Levels
Inside TradingView.
Updated every 60 seconds through our Chrome extension integration.
No separate dashboard · No stale morning levels · No tab-switching
First month free · $29.99/mo thereafter · Cancel anytime
What every line on the chart means.
A quick walkthrough of the gamma levels GammaFlux draws on your TradingView chart — call walls, put walls, gamma flip, and how the Chrome extension pushes data in real time.
What you’re actually getting.
| 01 | Update interval | 60 seconds during market hours (09:30–16:00 ET) |
| 02 | Symbols supported | SPY · QQQ · SPX · NDX + ES, NQ, MES, MNQ futures via fair-value conversion |
| 03 | Levels tracked | 8 + spot price Call Wall · Put Wall · Gamma Flip · Flow Flip · P1 · N1 · AG1 · AG2 |
| 04 | Strike coverage | Full options chain All listed strikes for the front expiration |
| 05 | Convergence tolerance | ±$3 / ±$15 $3 for SPY, QQQ · $15 for SPX, NDX |
| 06 | Delivery method | TradingView Indicator + Chrome Extension + Web Dashboard Renders directly on your existing TradingView charts |
| 07 | Data source | Open Interest, Live Futures Volume, and Live Option Chain Data Updated continuously, calculated server-side |
| 08 | Authentication | Email + 6-digit PIN One active device per subscription |
Overnight OI alone
is a relic.
More than half of S&P 500 options volume now happens in contracts that expire the same day. Those positions open and close within hours and never touch end-of-day Open Interest. Any gamma tool that only uses daily OI snapshots is structurally blind to them.
GammaFlux uses live options chain data plus live futures volume as a proxy for dealer hedging activity. It’s a proprietary model — we don’t publish the exact math — but we’re transparent about every category of input and where it has limitations.
Yesterday’s levels, today.
- [×]Updates once per day, after the close
- [×]Completely blind to 0DTE flow
- [×]Levels frozen from yesterday's close
- [×]Missing the biggest intraday flow driver
Where dealers are hedged right now.
- [✓]Updates every 60 seconds during market hours
- [✓]Infers 0DTE flow from live futures volume
- [✓]Levels shift as dealer positioning changes
- [✓]Combines OI baseline + live options chain + futures tape
Nobody outside the dealer desks has perfect visibility into net dealer gamma positioning. Every third-party tool on the market — ours included — produces an estimate based on public data. What separates good estimates from bad ones is the quality of the input data and the soundness of the modeling assumptions.
Three surfaces. One live feed.
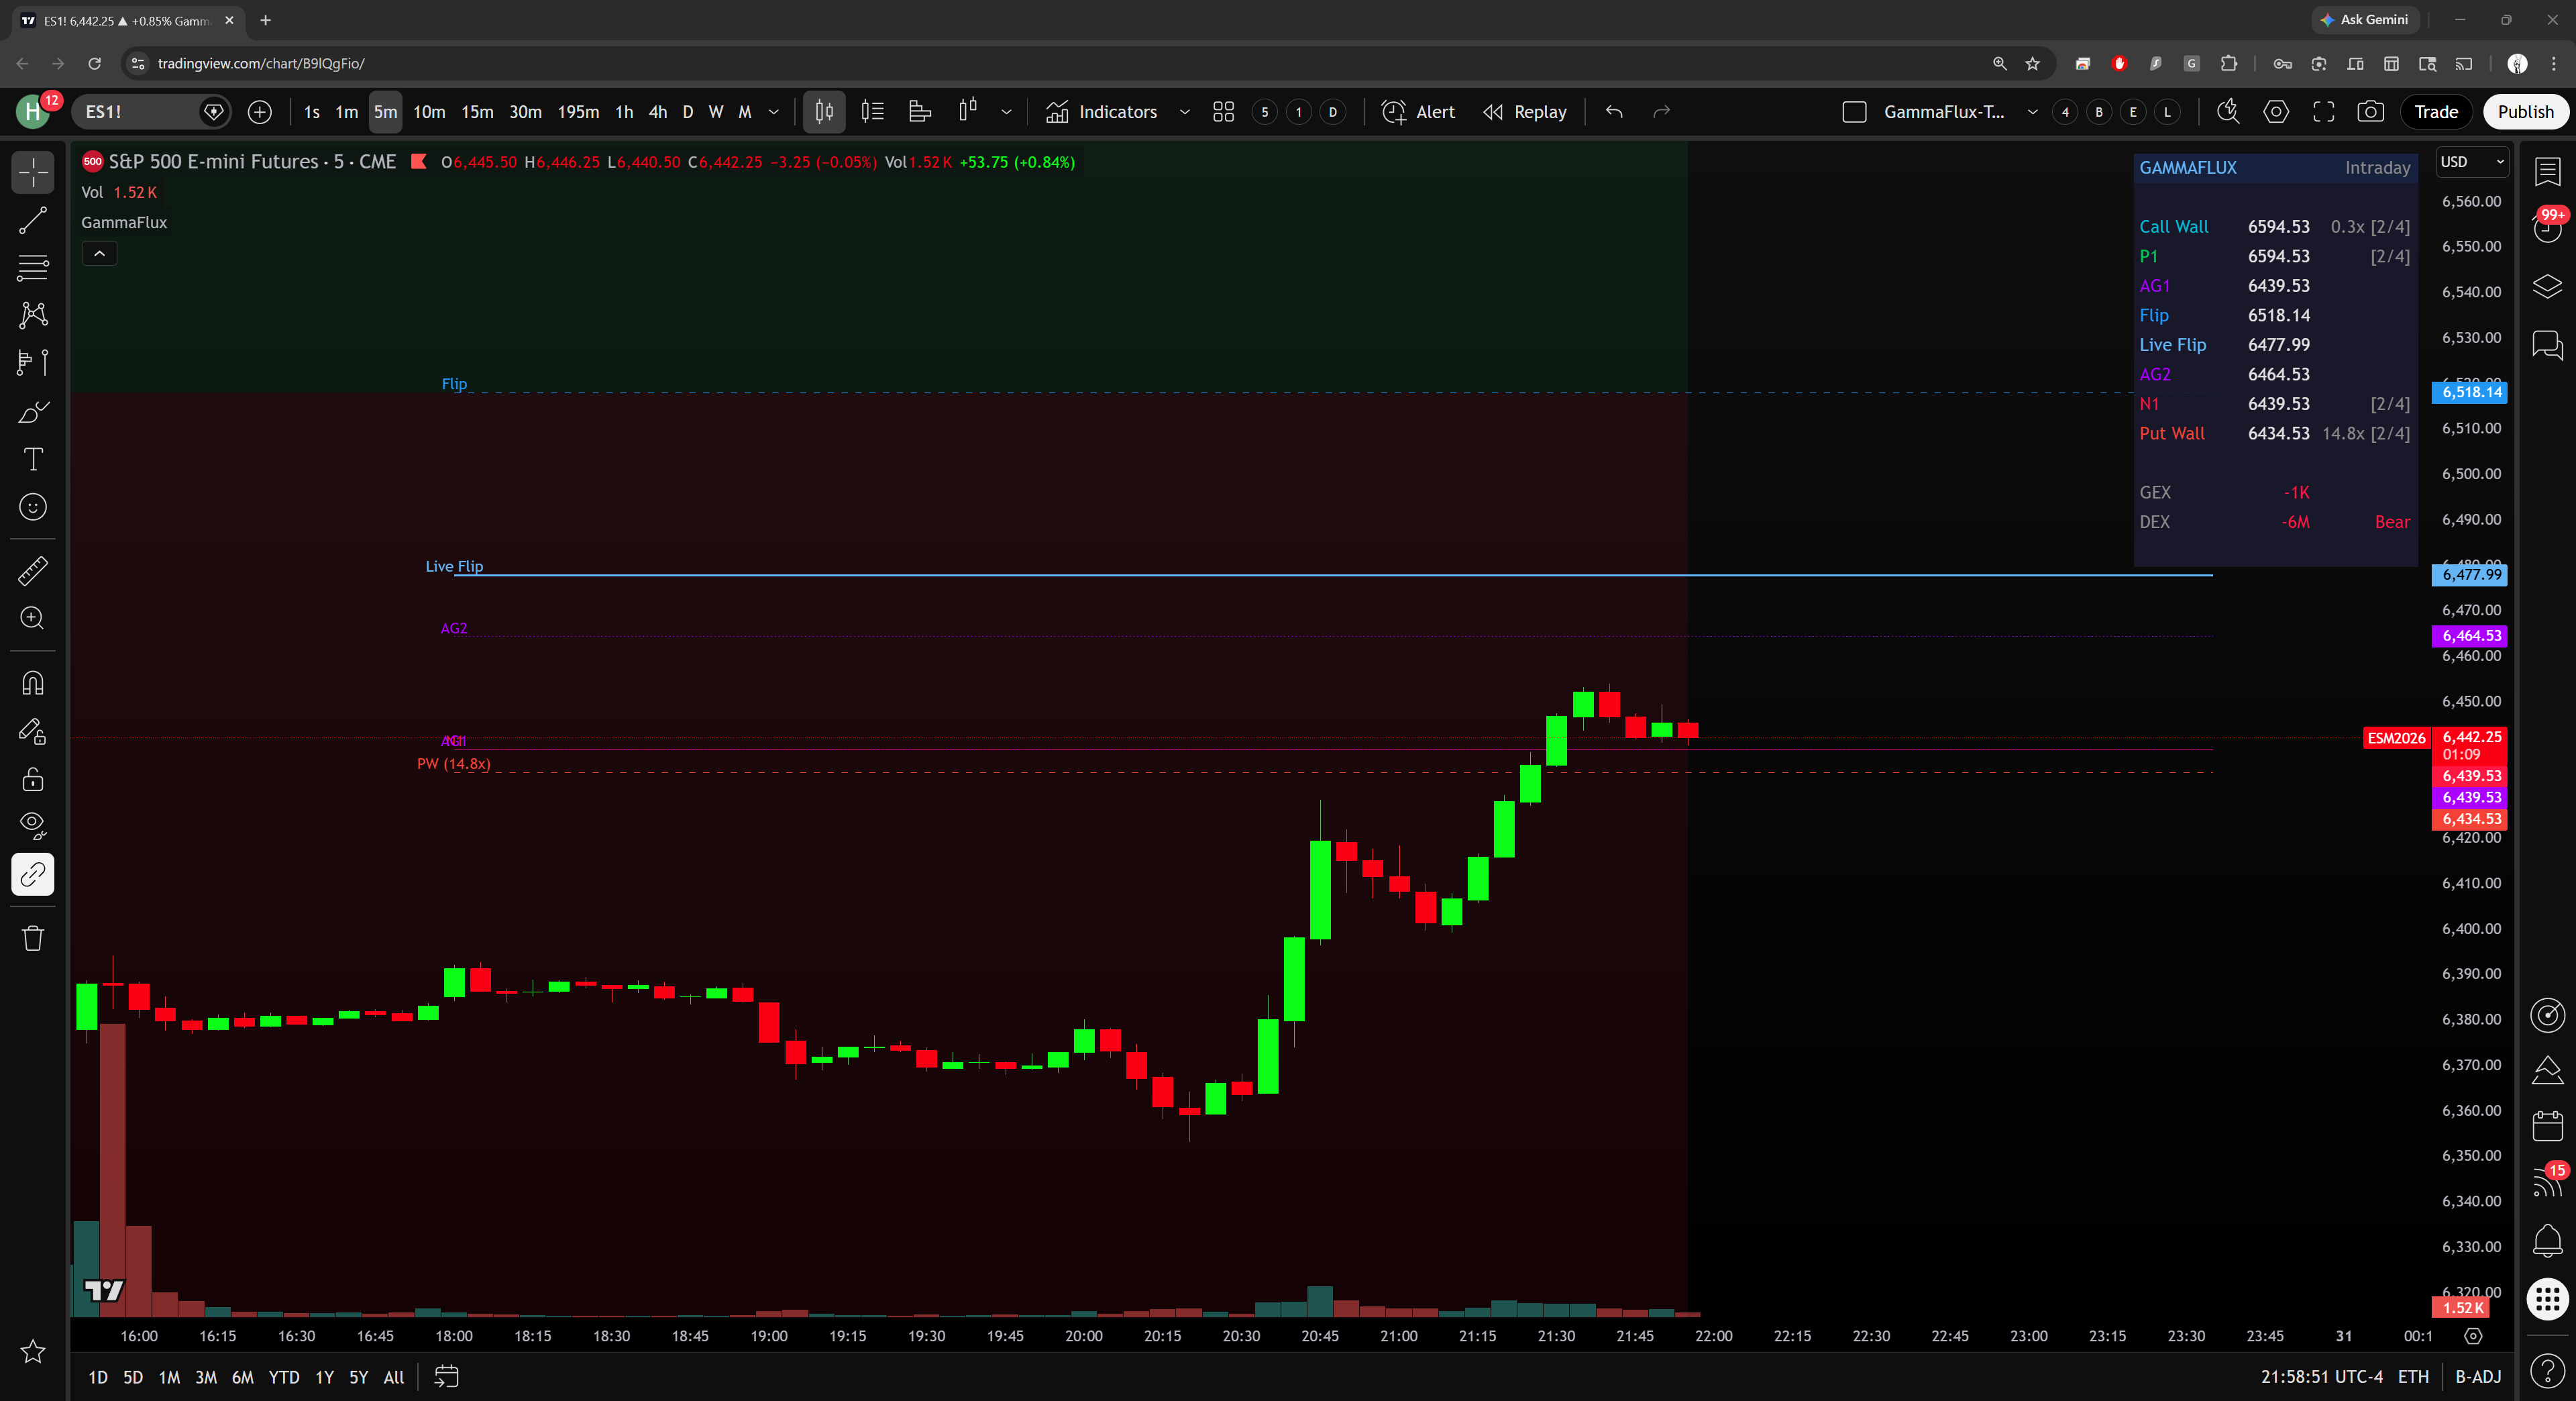
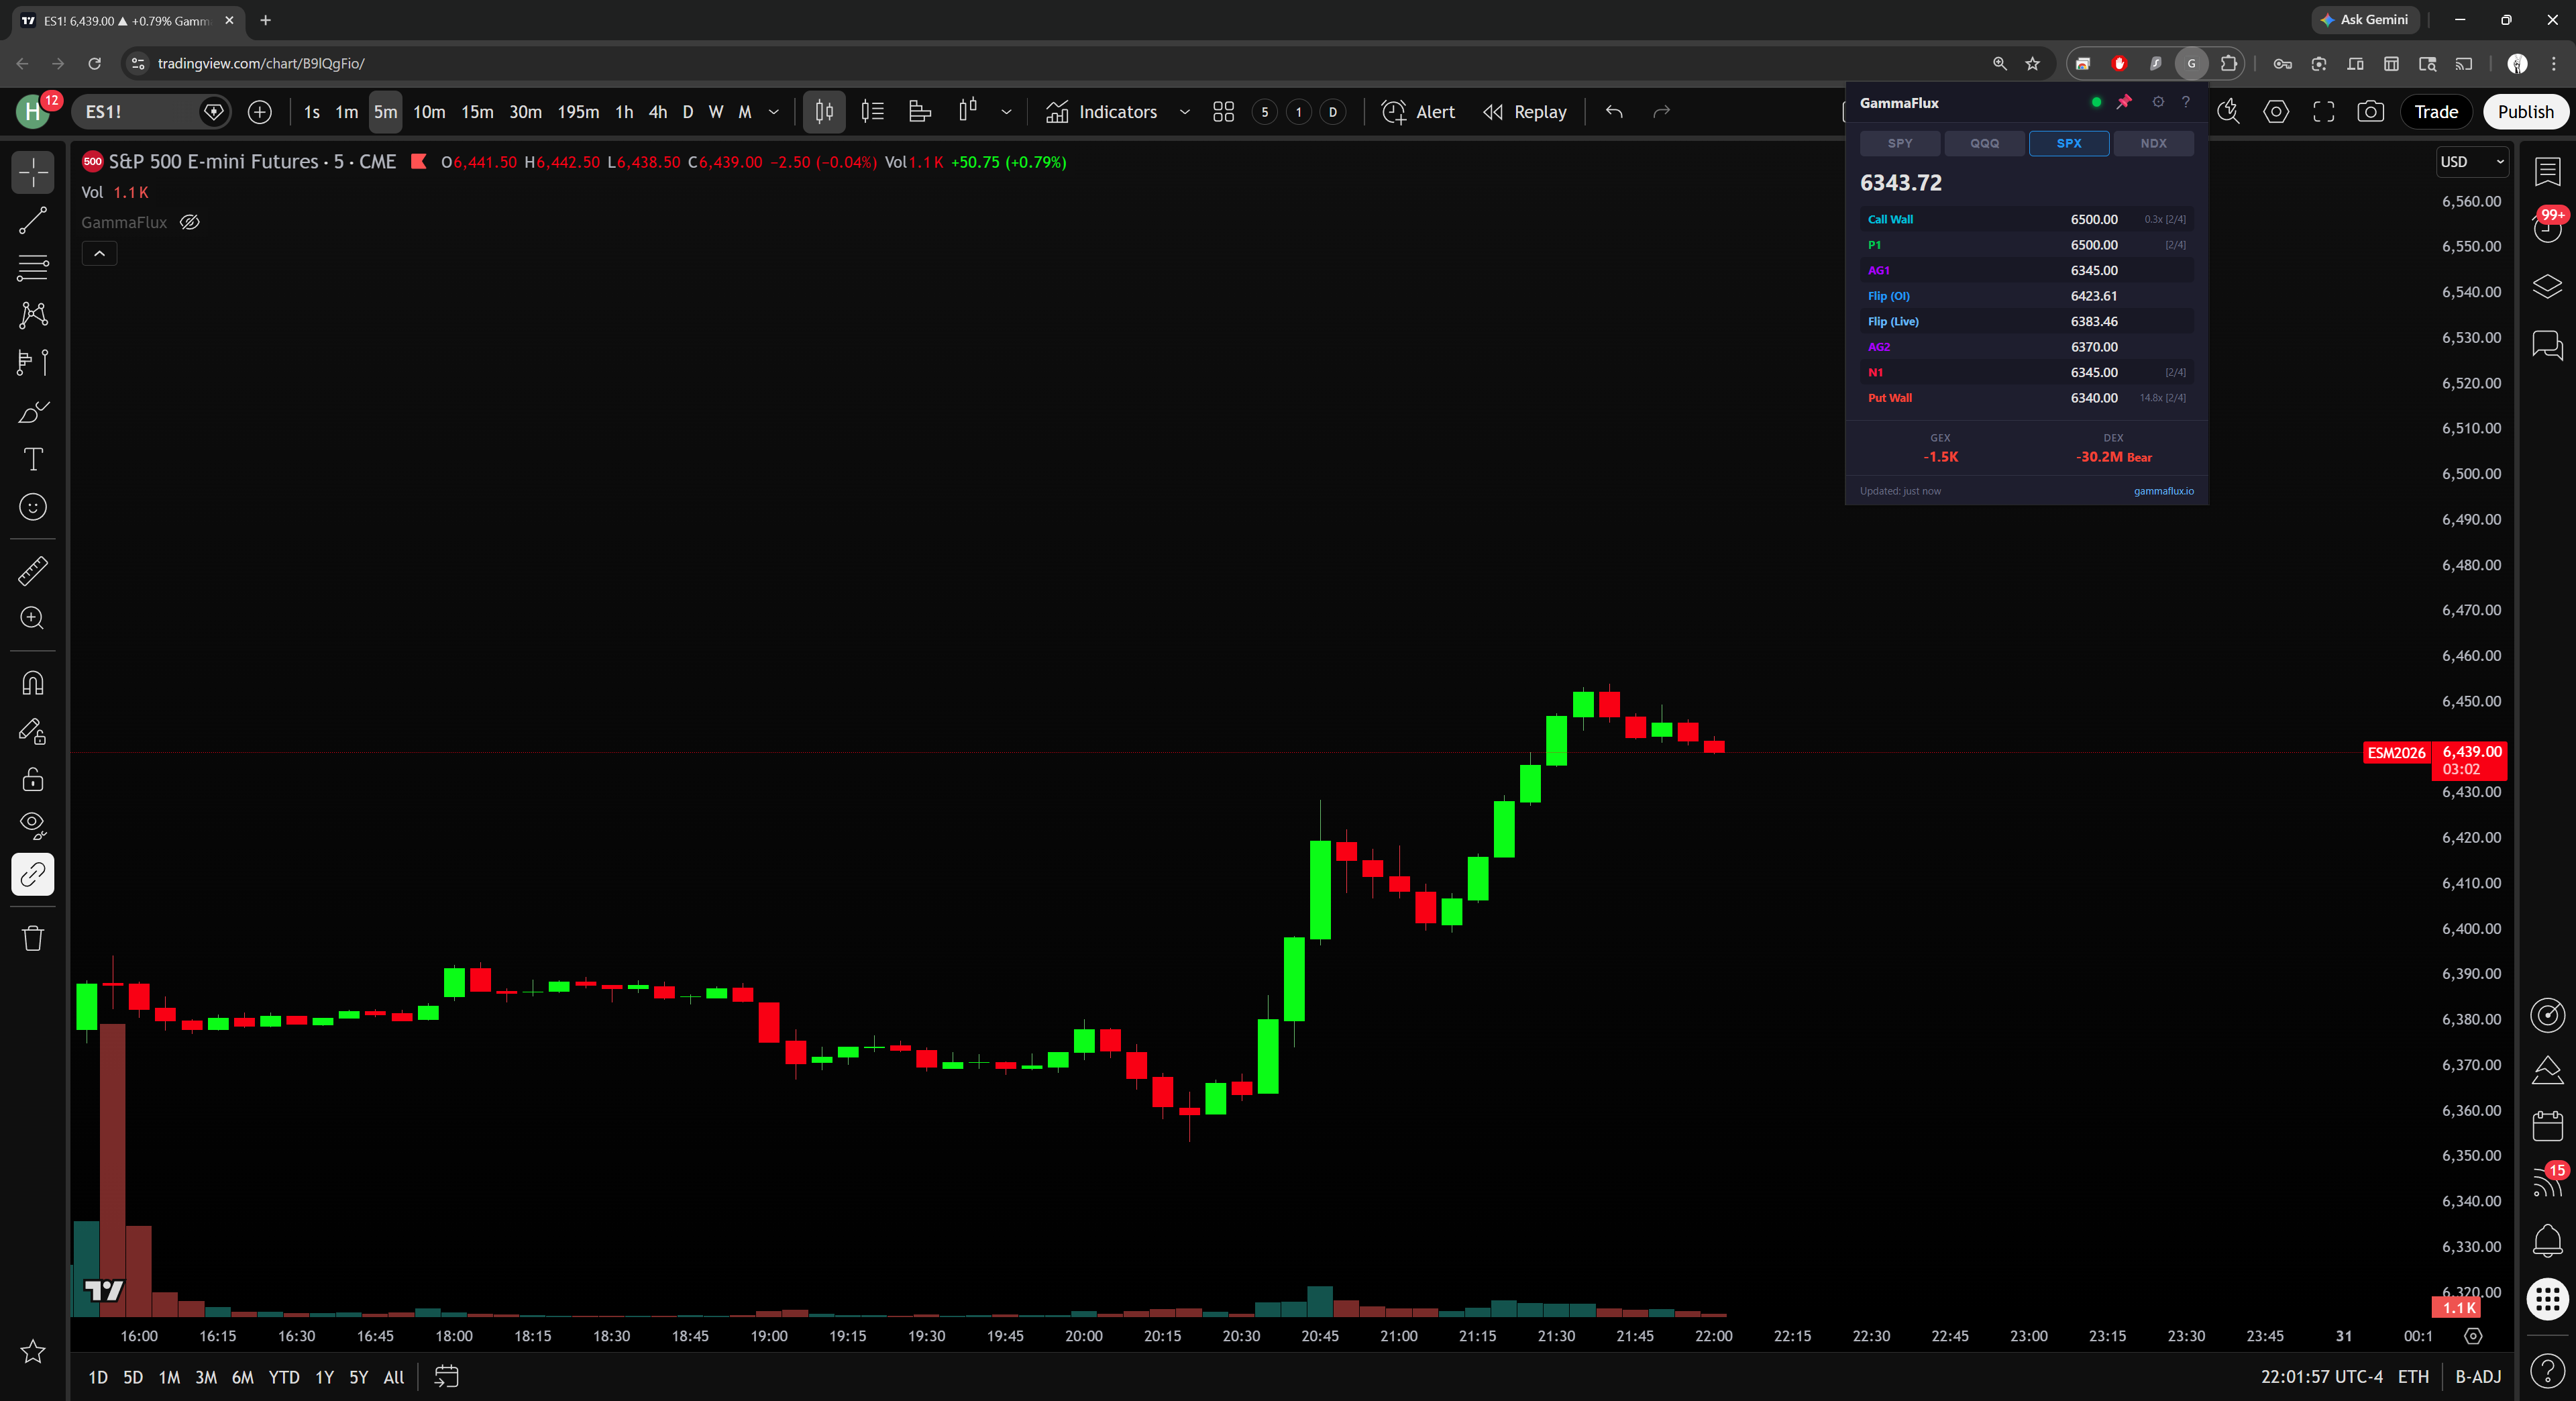
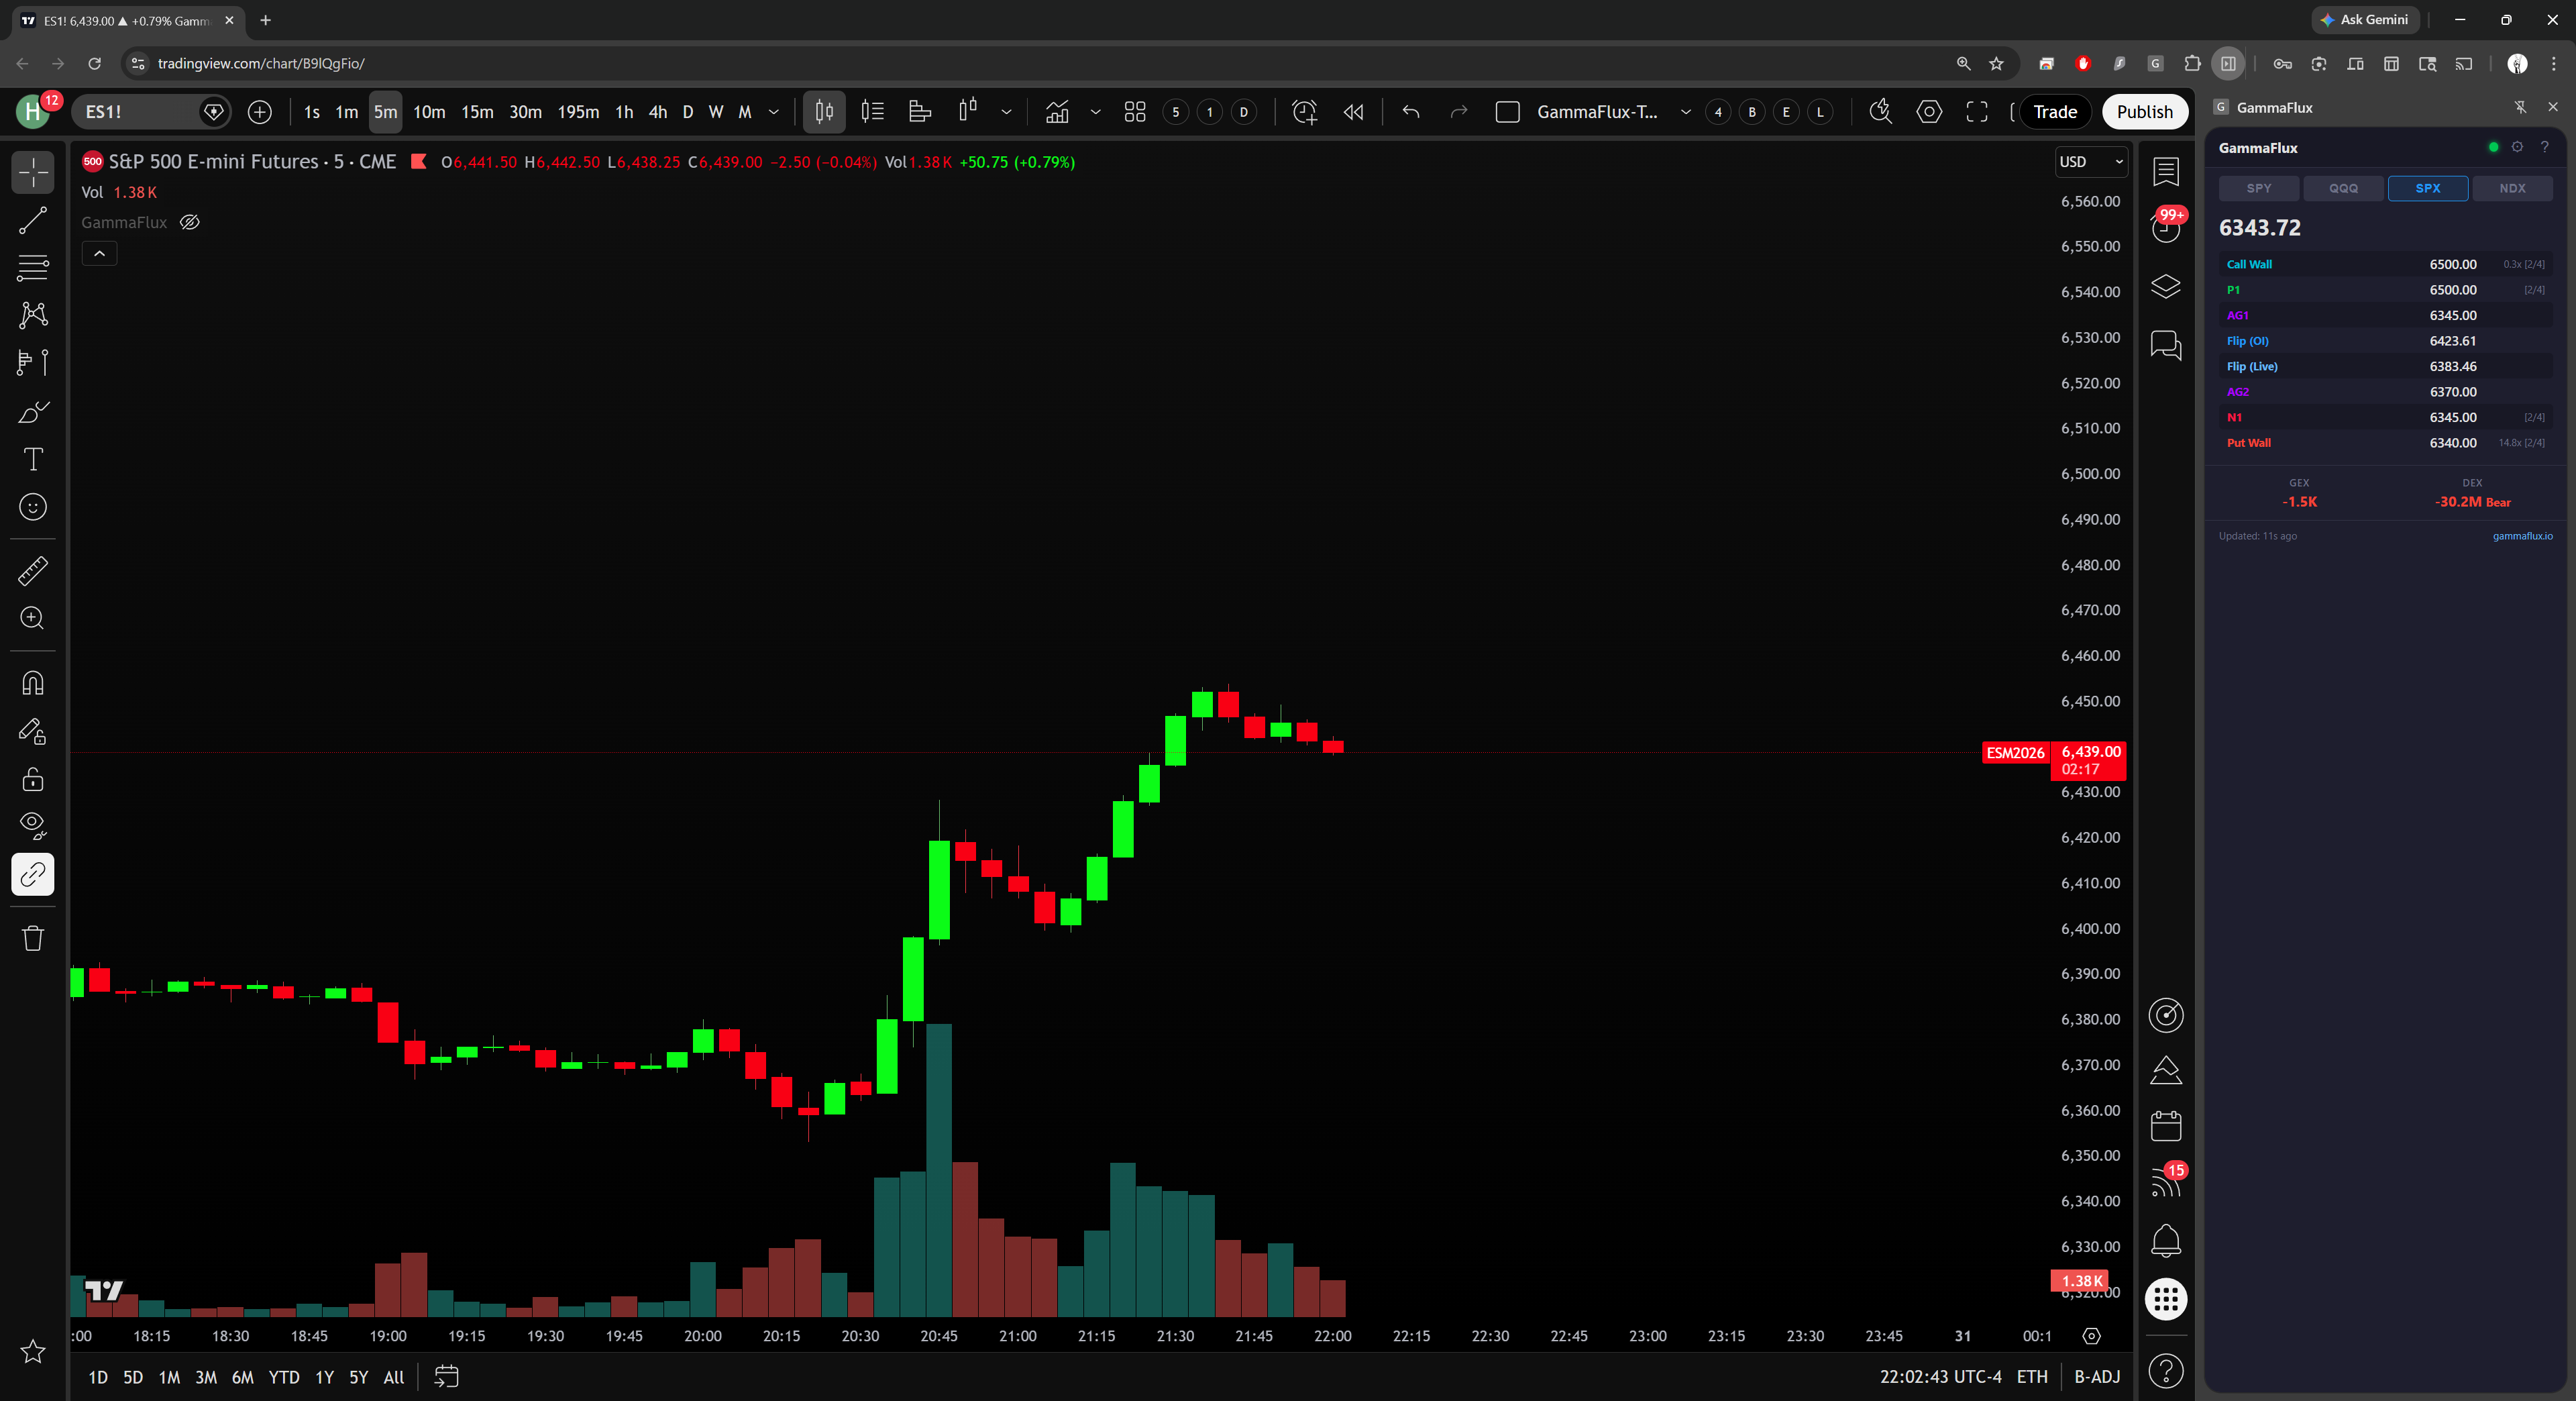
> Live gamma levels and the data table update every 60 seconds directly on your TradingView chart. No tab-switching.
Ready to trade with live gamma data?
Start your subscription and connect the extension to TradingView in under 5 minutes.
First month free · $29.99/mo thereafter · Cancel anytime